You are the Chief Investment Officer (CIO) of an asset owner with significant investments in private markets: Private Equity, Venture Capital, Private Debt, Infrastructure, Real Estate. You have secured top-tier managers, made large commitments, and are very excited about the potential for these funds to elevate your portfolio’s performance.
However, this opportunity comes with the crucial responsibility of effective oversight:
- How can you ensure optimal monitoring of these investments?
- What key performance indicators (KPIs) should you track?
- What's the most insightful way to present this data to stakeholders?
What is private markets portfolio reporting?
Private markets portfolio reporting is the process of aggregating and presenting investment data across a portfolio of private funds in a format that supports oversight, decision-making, and stakeholder communication. Unlike public markets reporting, private markets reporting must account for the illiquid and complex nature of fund investments — including capital calls, distributions, NAV changes, and look-through exposures — and present them in a way that is meaningful to audiences ranging from asset owners to investment committees. Effective reporting is a prerequisite for active portfolio management in private markets.
Measure = Manage
If these questions resonate with you, you're in good company. The complexities inherent in private markets often leave Limited Partners (LPs) grappling with inadequate monitoring and reporting systems. This poses a significant challenge: without the right metrics, effectively managing risk and performance becomes an uphill battle, hindering your ability to optimize portfolio outcomes.
The good news is, reporting doesn't have to be a burden. In this blog, we'll explore the fundamental aspects of private markets portfolio reporting, drawing insights from the best practices of leading private markets allocators. Let's get started.
Start with your audience
To tailor your reporting effectively, start by considering these key questions:
- Who is the primary audience for this report? Understanding their role and level of expertise will help you determine the appropriate level of detail and complexity.
- What are the key strategic questions they are likely to have? Anticipating their information needs ensures your report addresses their primary concerns.
- What supporting data or materials might be necessary? Having relevant backup information readily available strengthens your analysis and fosters transparency.
By addressing these questions, you can identify the essential components of your report, distinguish between must-have and nice-to-have elements, and fine-tune the depth and complexity of your analysis.
Let's illustrate this with examples of different stakeholder types and their potential focus areas:
|
Stakeholder |
Key strategic questions |
Key slides to include |
|
Asset owner |
How large is my exposure? How well is the portfolio performing? How much liquidity is it likely to absorb / generate? |
High level aggregate portfolio statistics: exposure and performance |
|
CIO |
What asset classes are the largest contributors to risk and return? Is asset allocation in line with the risk / return goals of the portfolio? How should I pace commitments to hit deployment goals? |
Exposure and performance breakdown by asset class Cash flows and NAV projections |
|
Portfolio manager |
Which individual funds are over- / under-performing in each asset class? What deals are the funds making? Who are the winners and losers? Are valuations and leverage sustainable? |
Detailed schedules of fund-by-fund metrics Look through exposures Look through financials |
If you are just getting started and need a simple framework for tracking fund-level data before building out a full reporting stack, our Excel-based private fund tracker provides a practical starting point.
A reporting template for CIOs
Let's get practical and outline a reporting template tailored for CIOs overseeing investments in private market funds. This framework applies to both asset owners (like family offices, endowments, foundations, or pension funds) and asset managers (such as fund of funds).
At its core, this comprehensive deck should encompass the following key components:
- Aggregate portfolio statistics
- Asset allocation breakdown
- Valuation bridge
- Fair value bridge
- Investment schedule
- Look-through analysis
- Liquidity and NAV projections
#1: Aggregate portfolio stats
Your reporting should begin with a clear and concise "executive summary" that highlights your portfolio's exposures and performance. Here is an example:
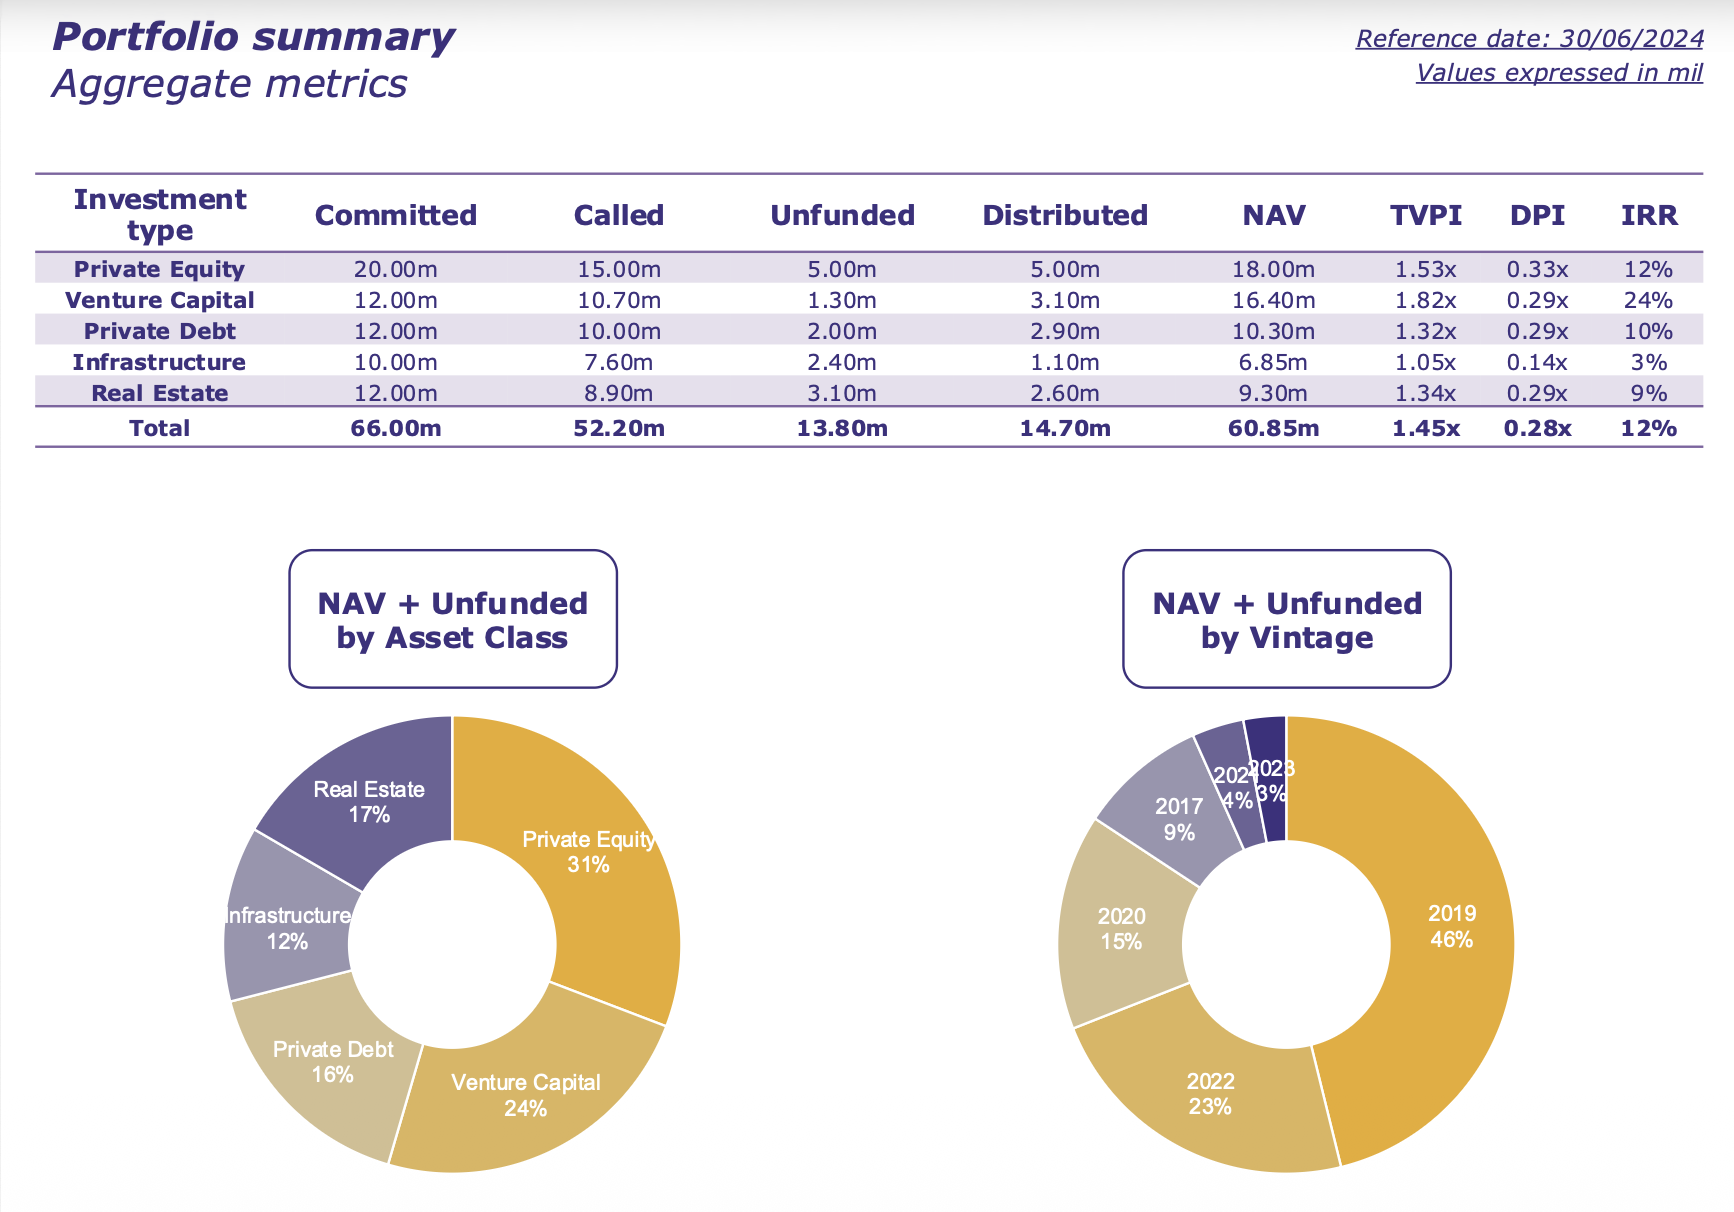
You'll notice the table includes various metrics for both exposures (committed, called, unfunded, NAV) and performance (TVPI, DPI, IRR). This comprehensive view is crucial because private funds are complex investments, and focusing on just a few metrics can be misleading. For example, a high IRR might initially seem impressive, but it loses significance if paired with a low TVPI (meaning less cash has been returned to investors than one would imagine). Similarly, a large commitment might appear noteworthy, but if tied to older vintages, it may have a minimal impact on current NAV and unfunded amounts. By presenting all these metrics together, CIOs can quickly gain a balanced understanding of the portfolio's health.
Of course, you can (and should) include additional information as needed. More sophisticated versions of this table might incorporate metrics like Public Market Equivalents (to compare private market allocations with their liquid alternatives) and relevant Benchmarks (to assess the investment team's manager selection skills).
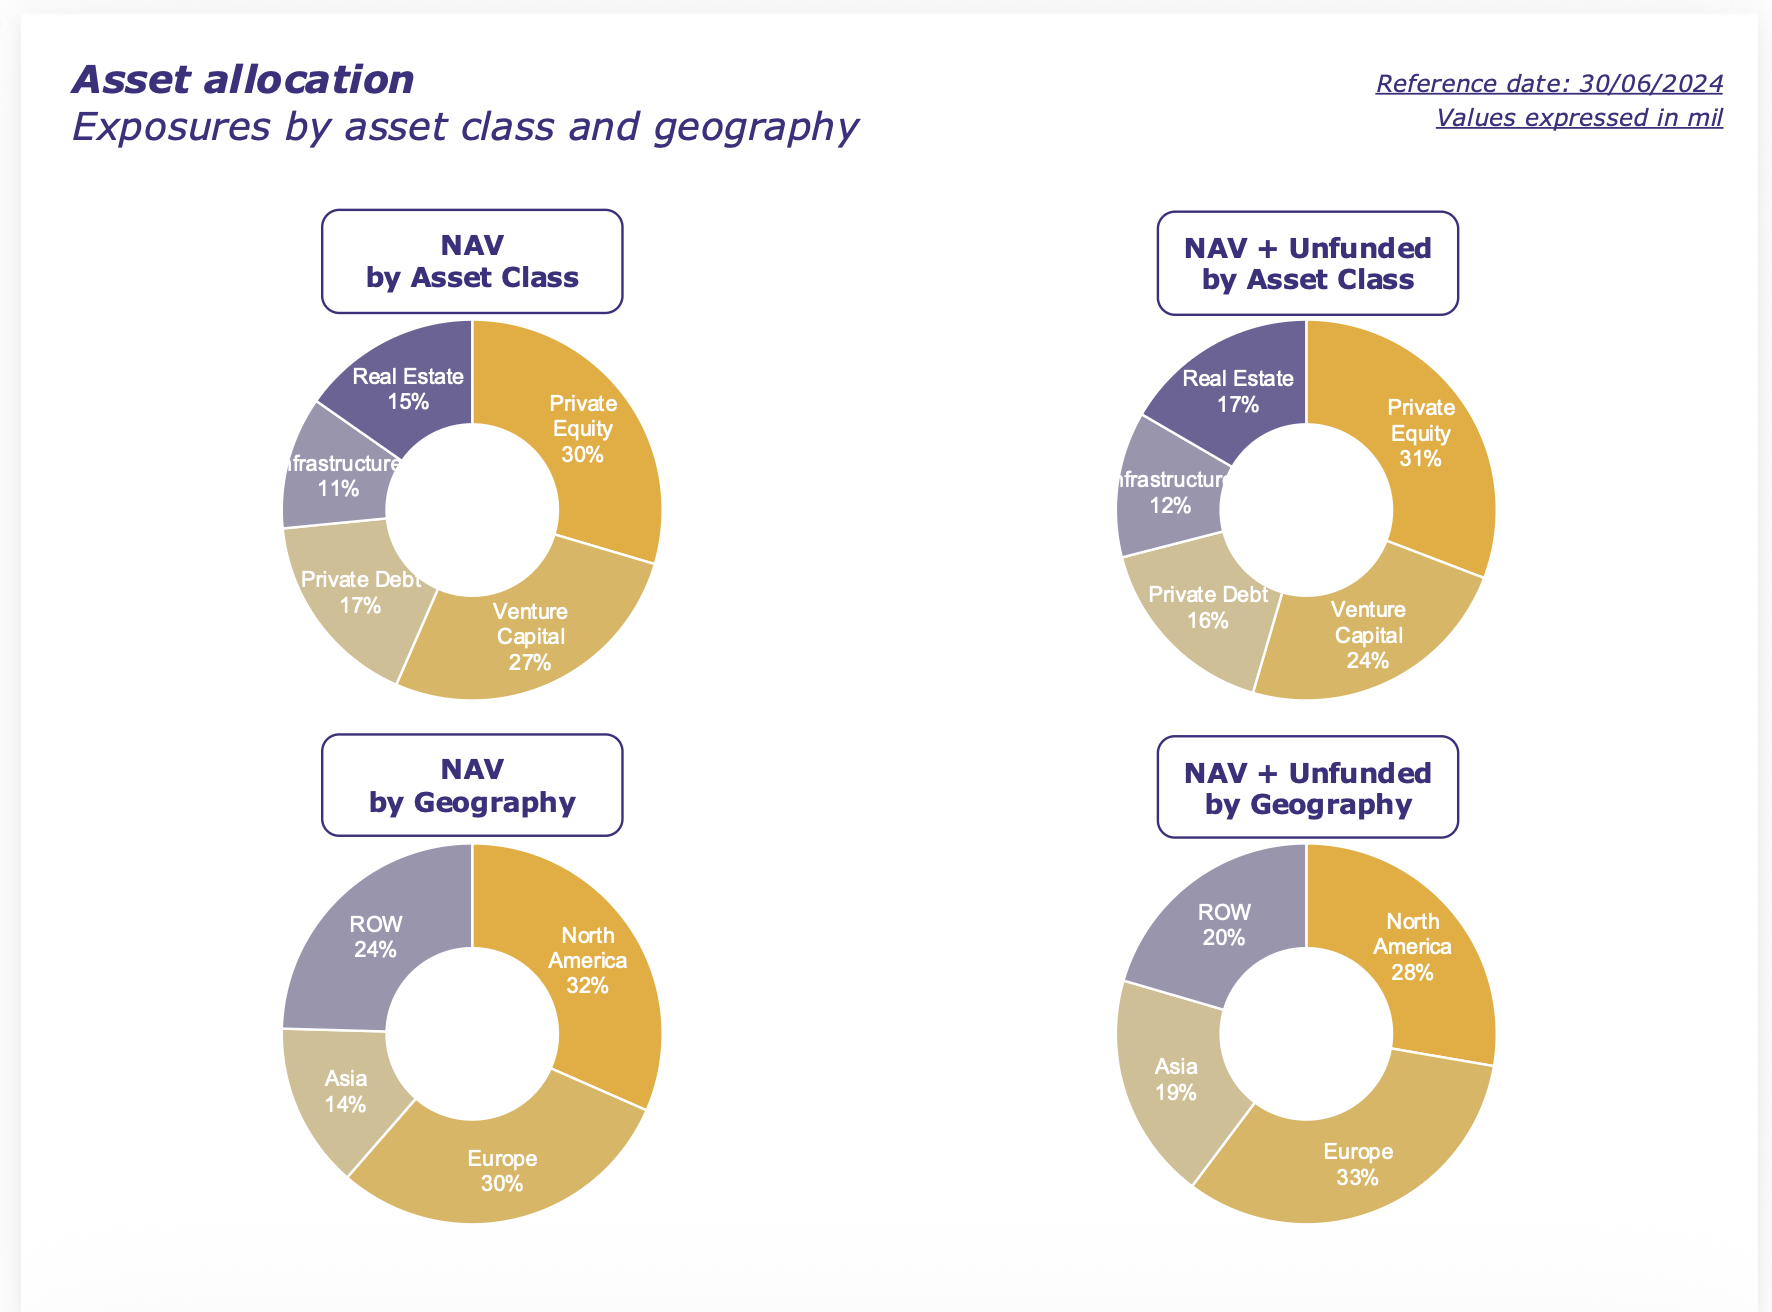
#2: Asset allocation breakdown
Asset allocation is a critical driver of portfolio risk and performance, often overshadowing even the most astute manager selections. CIOs understand this, and dedicate significant time to strategizing and adjusting their asset allocation in response to macroeconomic shifts and emerging opportunities. Consequently, a comprehensive report must include robust metrics on asset allocation.
In practice, your asset allocation KPIs will hinge on two key factors:
- The asset classes chosen as the foundation of your private markets portfolio. A common approach is to categorize private investments by broad classes like Private Equity, Venture Capital, Infrastructure, Real Estate, and Private Credit. However, more nuanced classifications are possible.
- How you define your exposures. NAV is frequently used, as it closely approximates "market value" and facilitates comparisons with liquid assets. However, NAV is a lagging indicator of asset allocation decisions. For instance, a recent $10 million commitment to Venture Capital won't be reflected in NAV until the fund draws down and deploys that capital. In such cases, adjusted exposure metrics like "NAV + unfunded" offer a more accurate picture.
Let's illustrate this with an example slide:
#3: Valuation bridge
The value of private market investments fluctuates not just because of performance, but also due to the flow of capital in the form of calls (capital drawn down by the fund) and distributions (returns of capital to investors). This can be represented by the following equation:
NAV (current quarter) = NAV (prior quarter) + Change in Fair Value (current quarter) + Calls (current quarter) - Distributions (current quarter)
The impact of cash flows is particularly pronounced for young funds (where NAV increases due to calls) and mature funds (where NAV decreases due to distributions). With numerous funds at different stages in a large portfolio, it's easy to lose sight of the primary factors driving NAV changes.
This is where NAV bridges are invaluable. They visually highlight the key components contributing to NAV movements, as shown in the example.
 Here, we can quickly see that the substantial $20.9 million increase in NAV is primarily attributed to a $19 million rise in fair value (good news!), while the effects of calls and distributions essentially cancel each other out.
#4: Fair value bridge
That +$19 million fair value change likely piqued your interest, and rightfully so! Wouldn't it be helpful to instantly pinpoint which funds are driving those gains (or losses)? That's where this next chart comes in. It provides a detailed breakdown of the total fair value change, attributed to each underlying fund: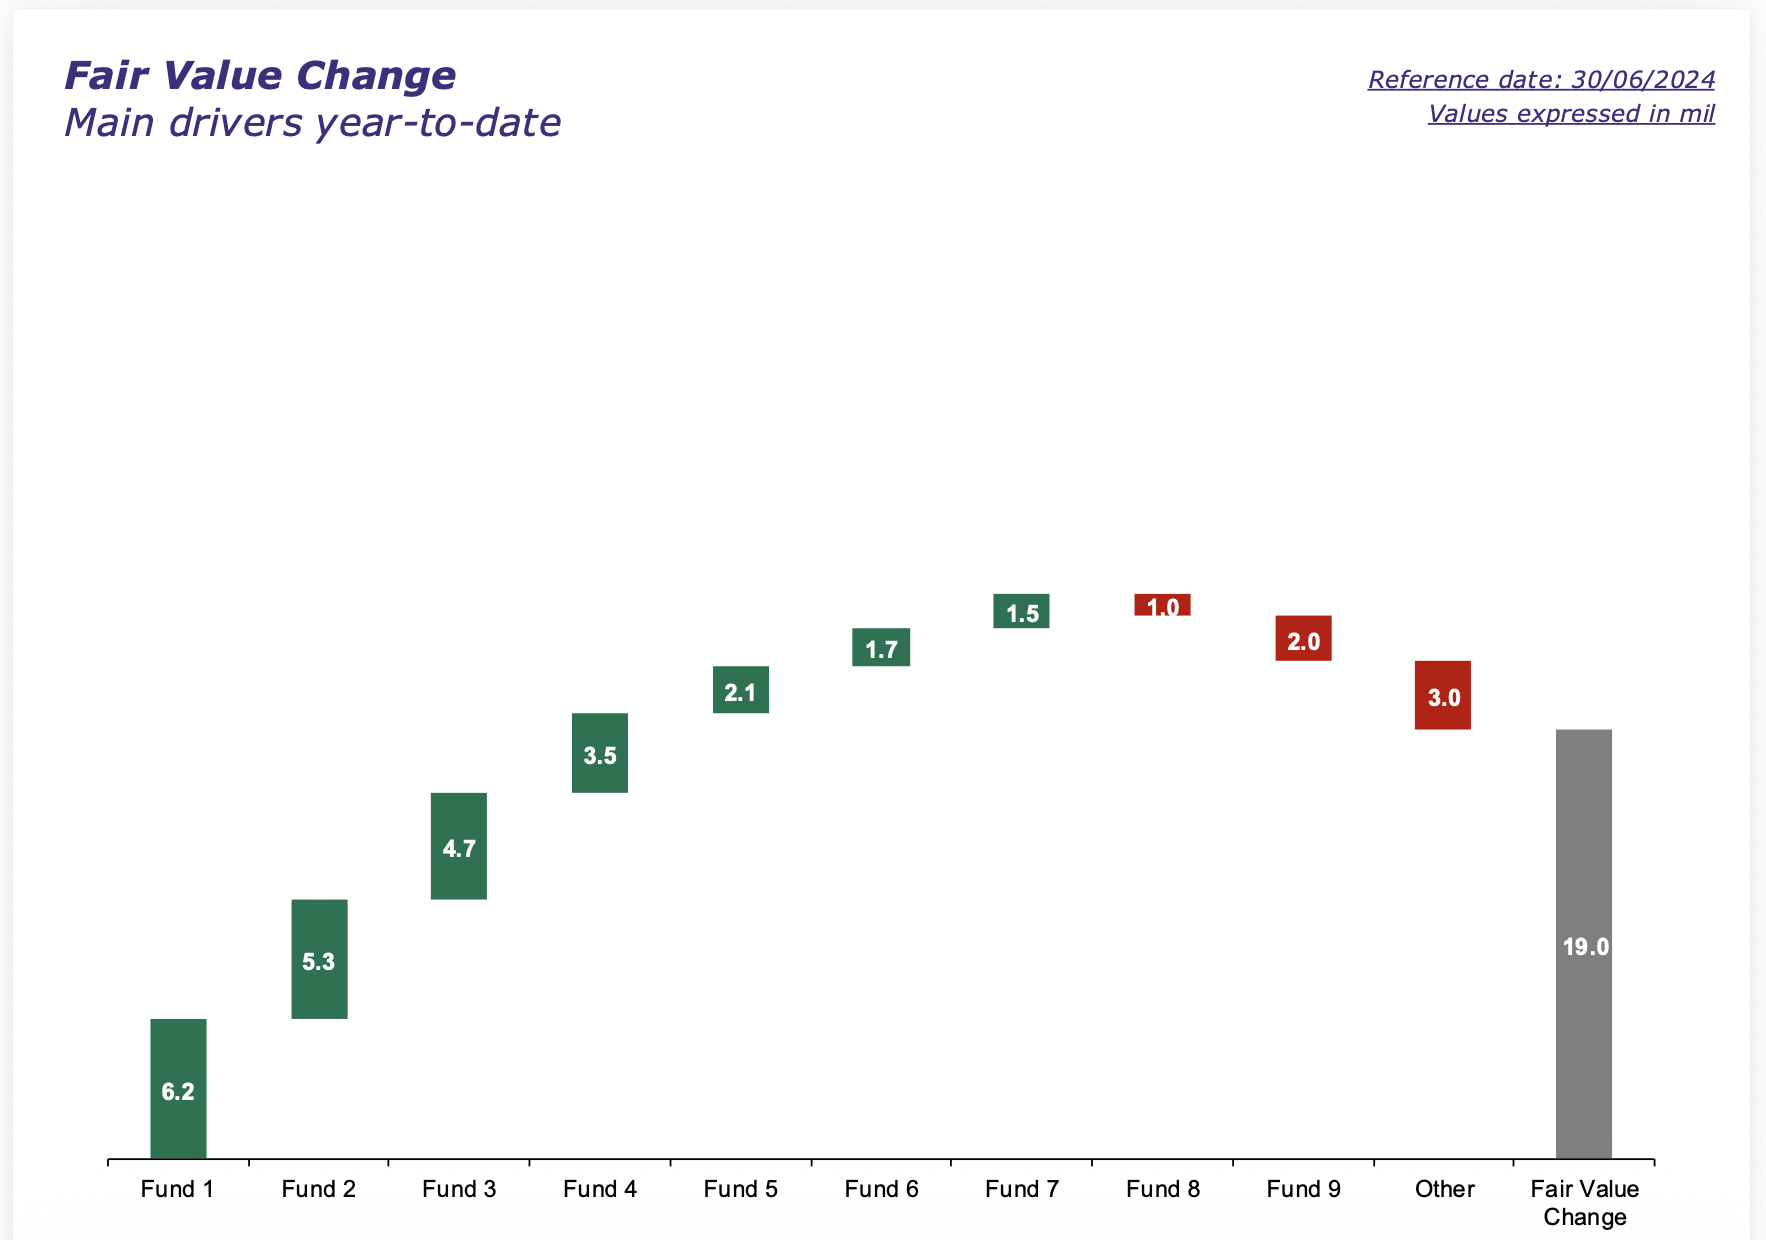
#5: Investment schedule
While the big picture is important, the details matter too. It's crucial to have readily available backup data on key exposure and performance metrics for each individual fund. However, with larger portfolios, these detailed lists can quickly become overwhelming. To enhance clarity and organization, we recommend grouping this information by asset class, as illustrated in this example: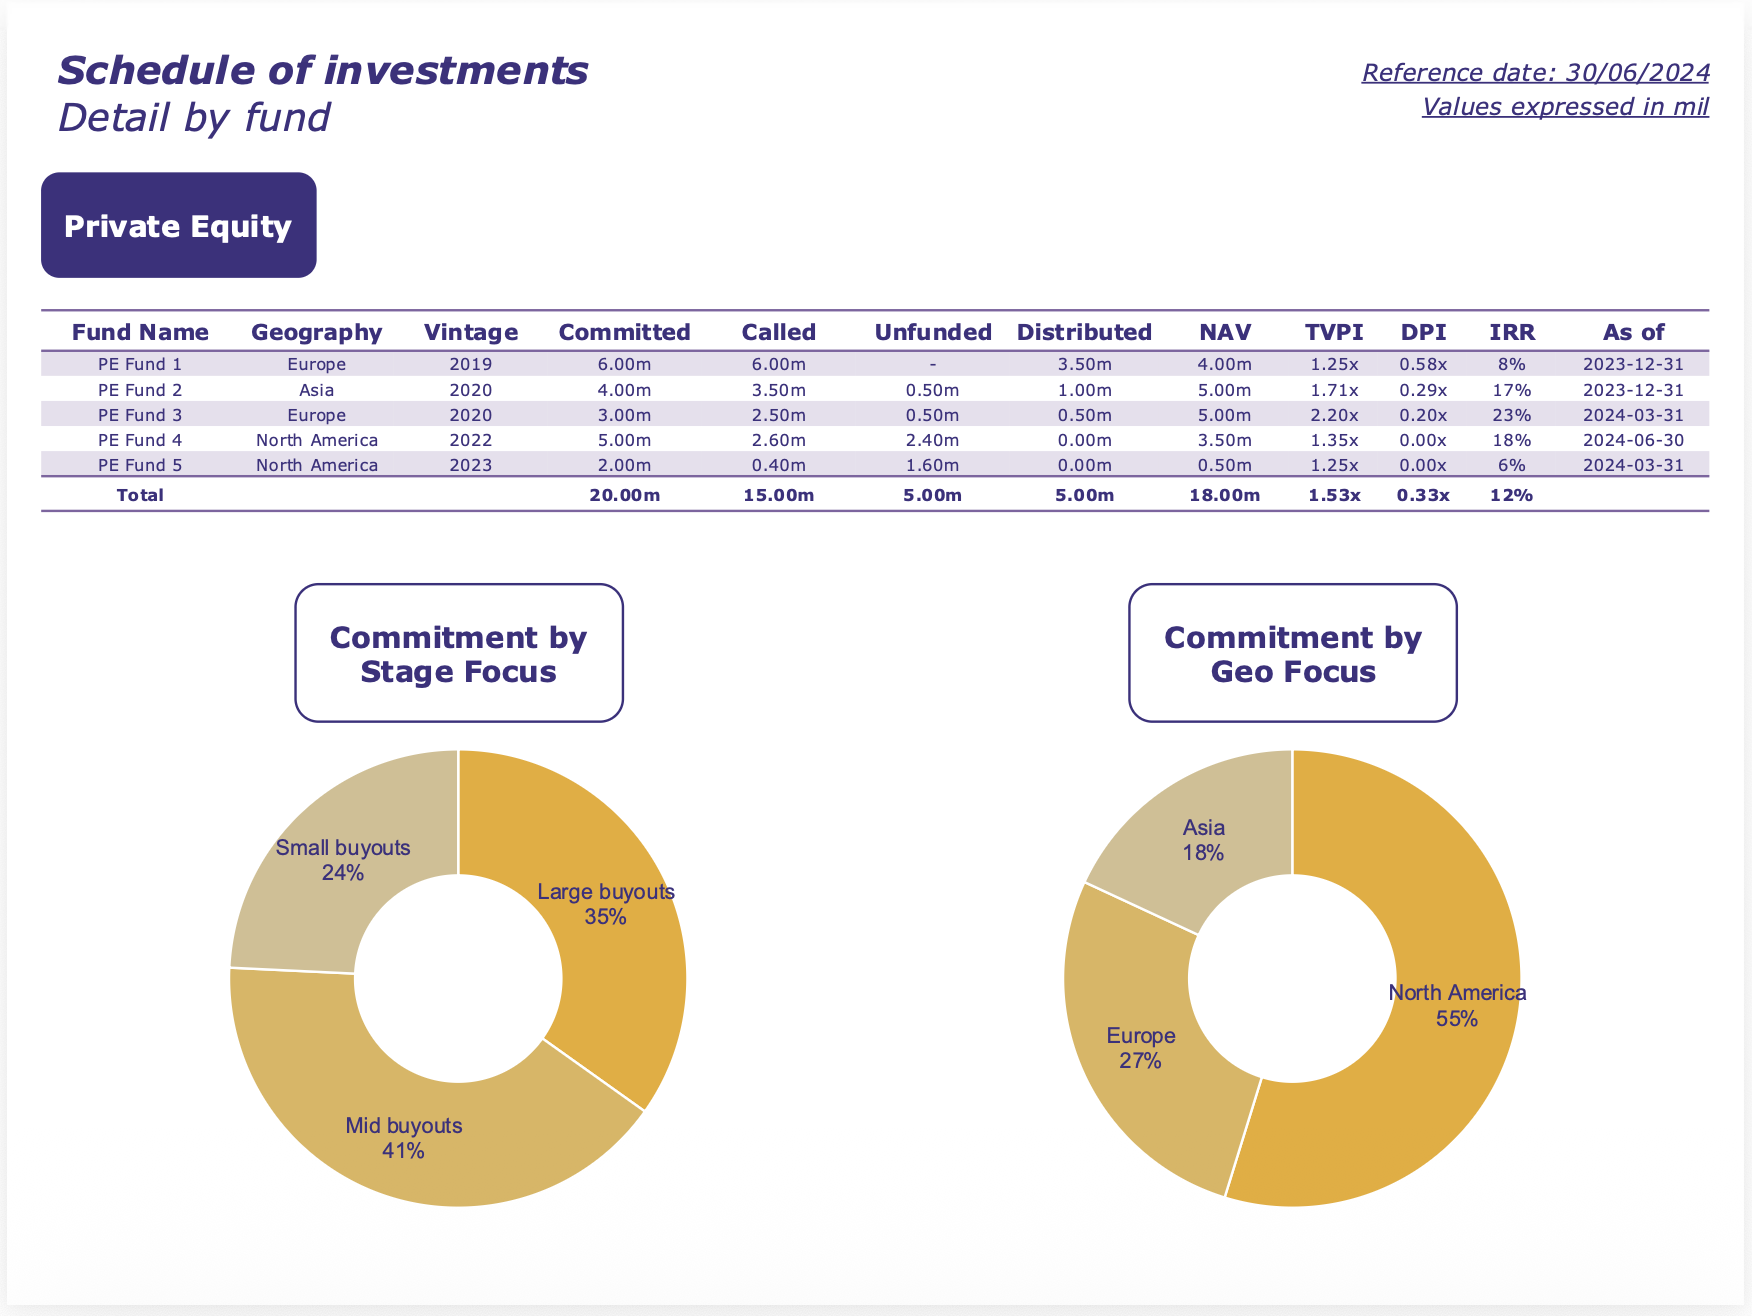
#6: Look-through analysis
Funds are often seen as opaque "black boxes" that simply take in capital and generate returns. However, adopting a "look-through" approach—analyzing the underlying investments within those funds—is crucial for assessing risk and uncovering potential opportunities.
Key questions a CIO might ask include:
- Sector and Size Exposure: Is the portfolio tilted towards cyclical or non-cyclical sectors? What's the breakdown across small, mid, and large-cap companies?
- Valuation: What are the underlying valuations supporting the NAV? Are they reasonable, stretched, or potentially undervalued?
- Debt Levels and Distress Risk: Are the underlying companies carrying excessive debt? What's the potential risk of financial distress?
By leveraging look-through data, CIOs can gain valuable insights to answer these critical questions and make more informed investment decisions.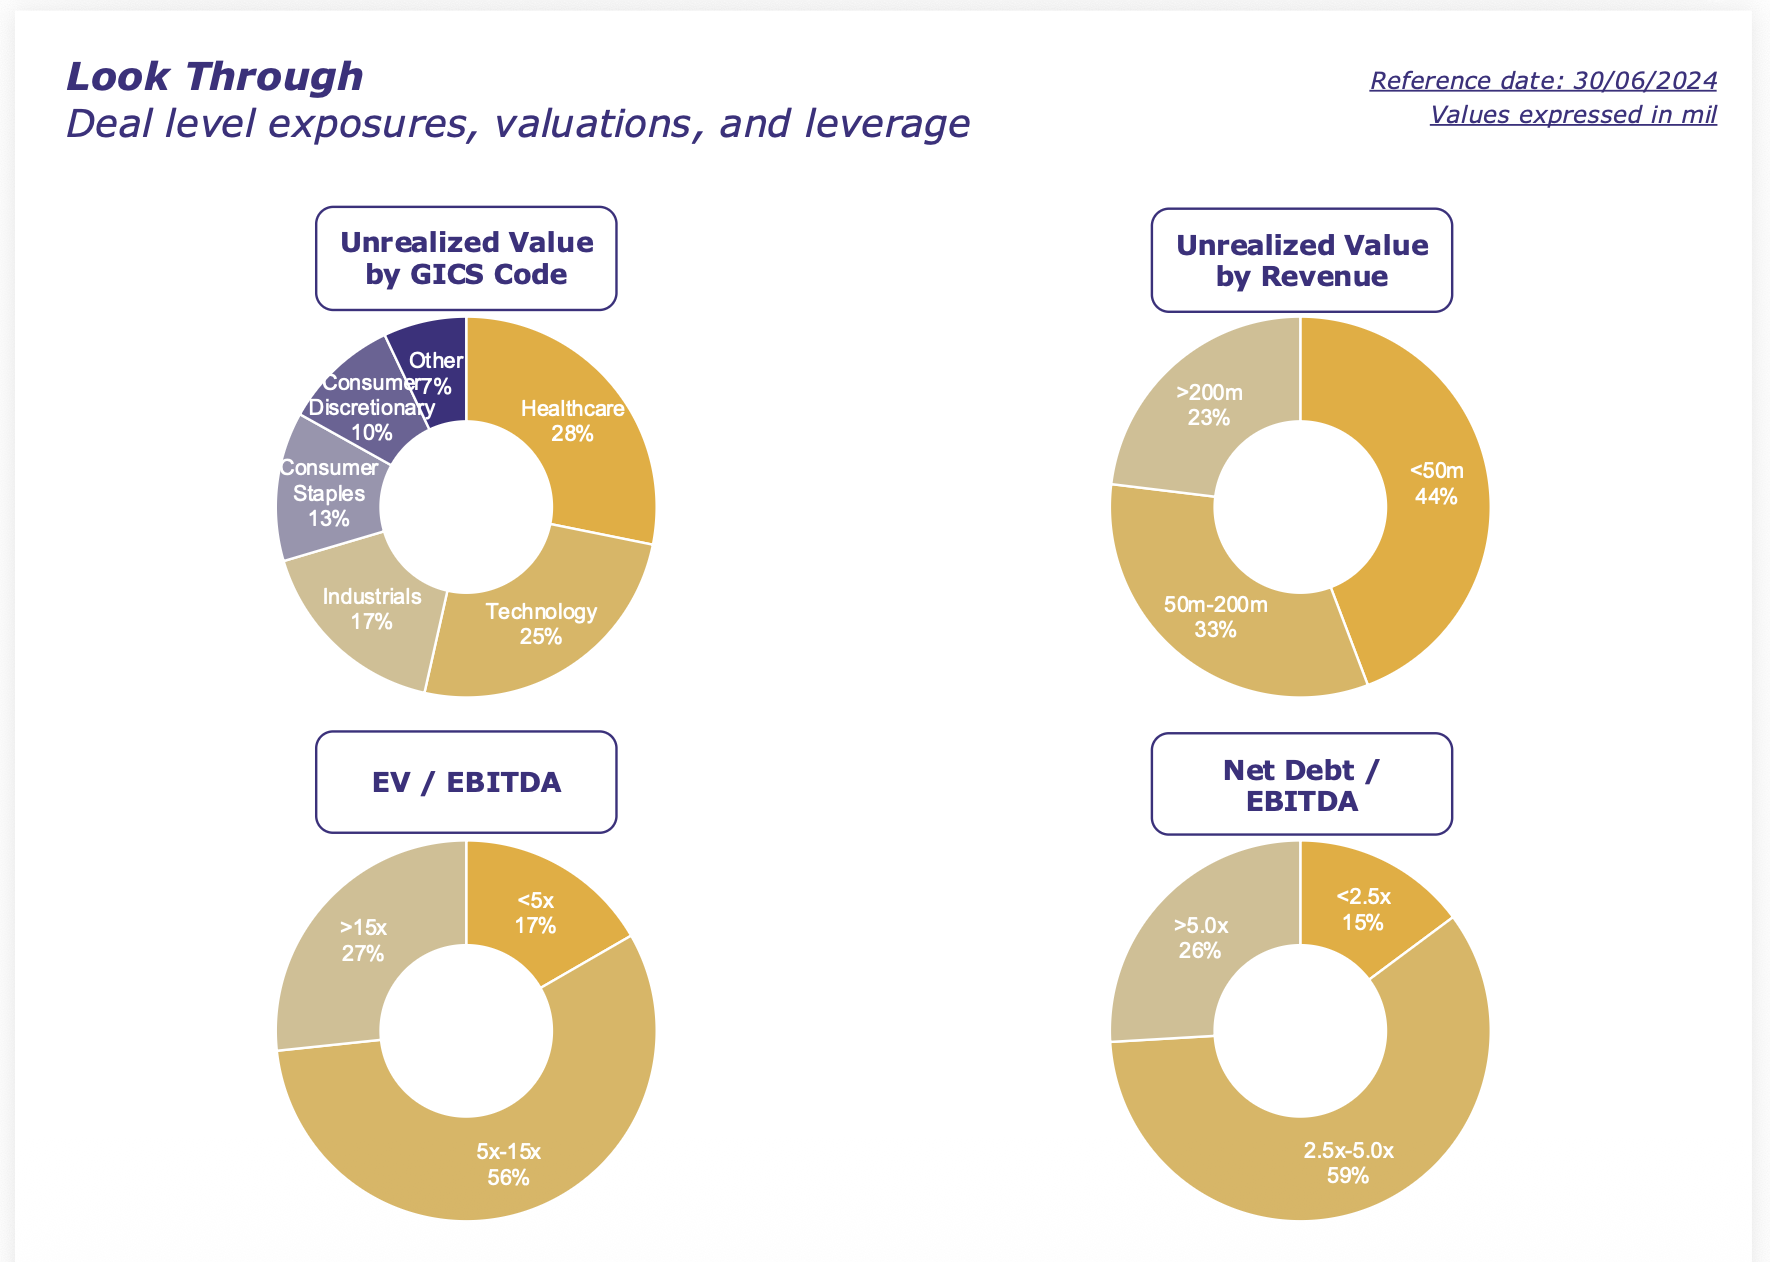
#7: Liquidity and NAV projections
Private markets investments are notoriously difficult to time correctly. Commit too much capital too soon, and you risk over-allocation and liquidity shortages. Commit too little or too late, and you jeopardize your ability to reach target returns. Therefore, CIOs consistently model the pacing of their new commitments, carefully considering target exposures and liquidity constraints (see here for an example of a forecasting model).
This is why a recap of liquidity and NAV exposures can be incredibly helpful. To help decision making, consider separating forecasts for existing commitments from those planned but not yet executed ("roadmap" commitments), as shown in the example:
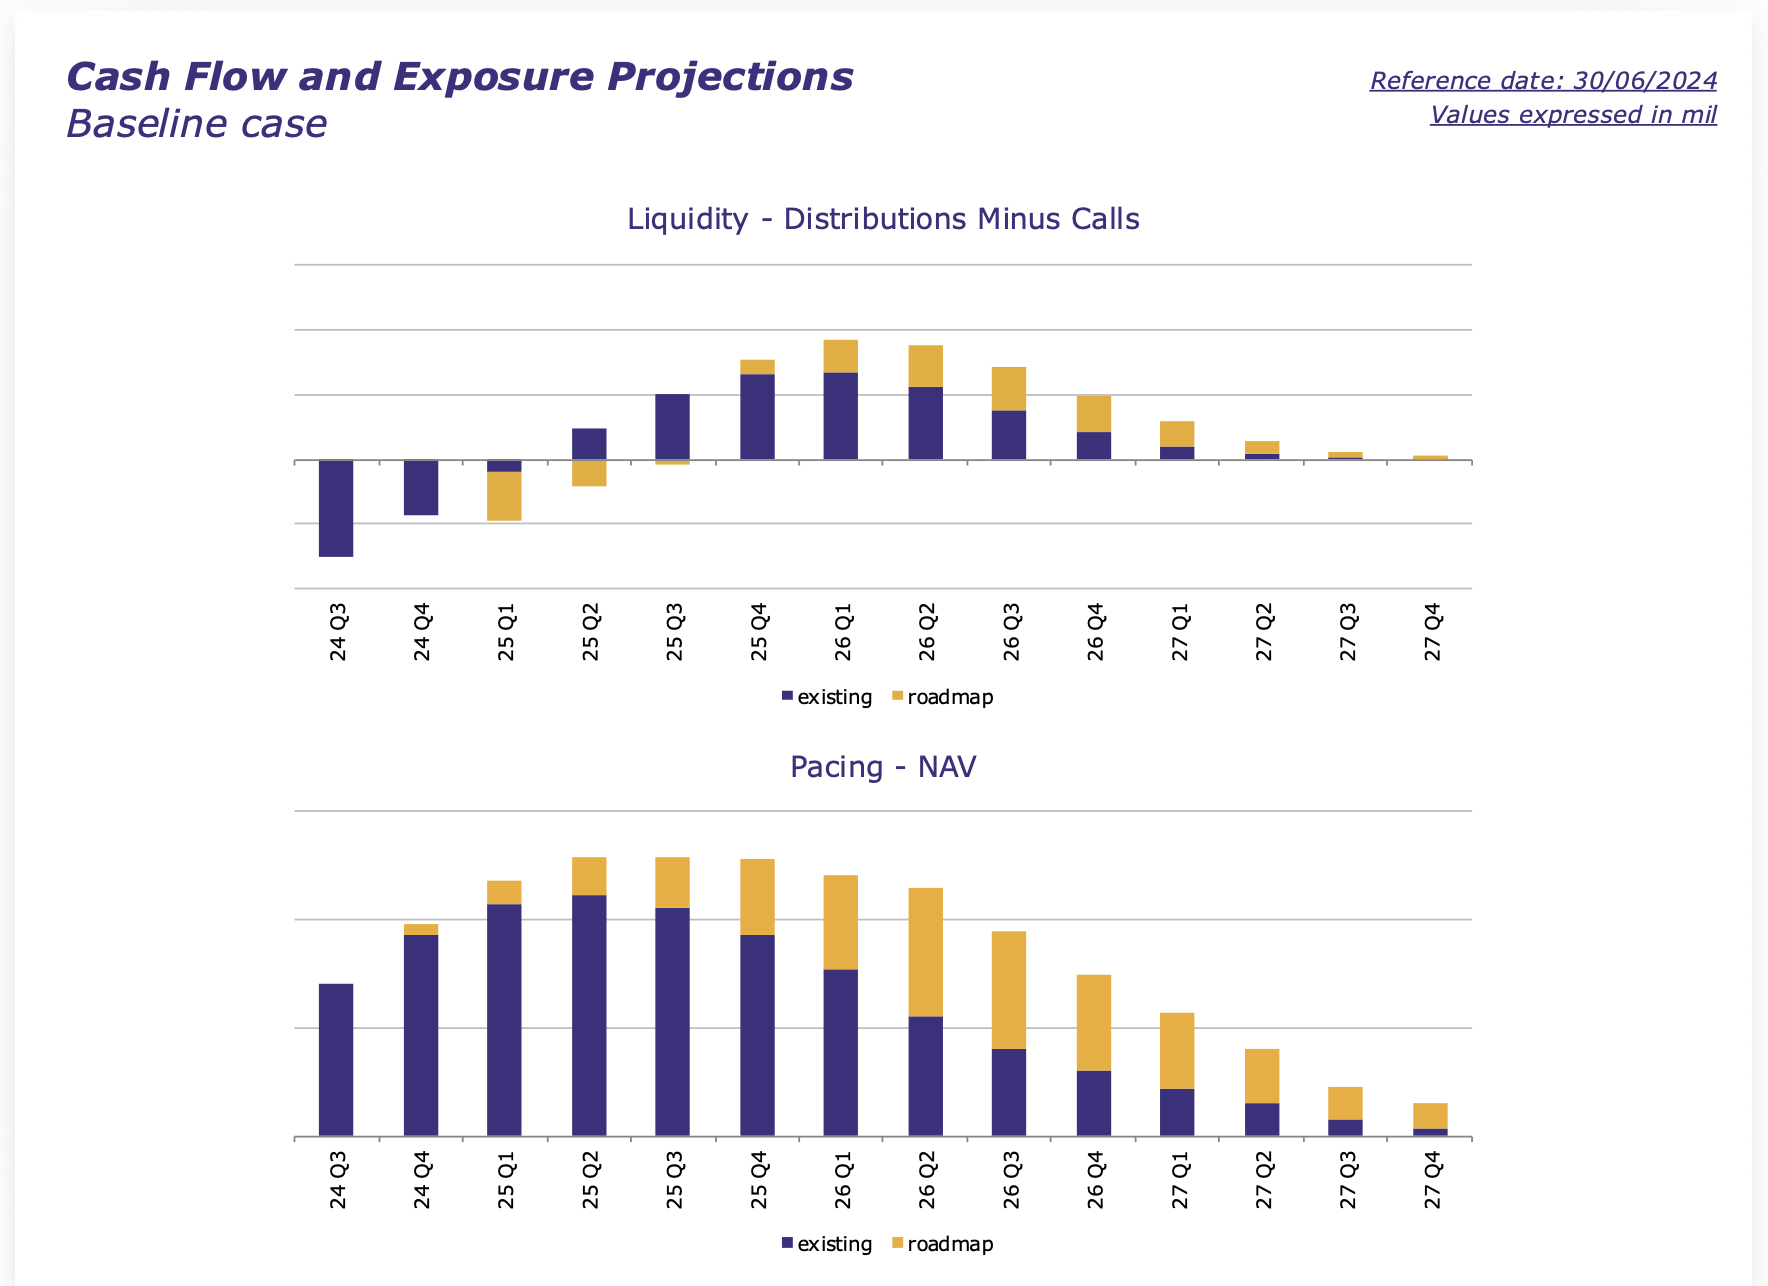
For added value, incorporate sensitivity analyses by including "downside" and "upside" scenarios in your projections.
Summary
Effective private markets reporting for CIOs requires seven core components: aggregate portfolio statistics covering exposure and performance; an asset allocation breakdown by strategy; a NAV bridge showing the drivers of value change in the period; a fair value bridge attributing performance to individual funds; an investment schedule with fund-level detail; a look-through analysis of underlying portfolio company exposures; and liquidity and NAV projections separating existing from planned commitments. The right level of detail varies by audience — asset owners need high-level exposure and performance, CIOs need allocation and pacing analysis, and portfolio managers need fund-level and look-through data. A downloadable reporting template is available below.
Download the LP Reporting Template
👉 Download the LP reporting template by submitting the form on the left.
If you are building or refining your private markets reporting framework, this template provides a practical starting point for structuring portfolio exposure, performance, liquidity, and asset allocation in a format suited for CIOs and investment committees.
As portfolio complexity grows, Tamarix helps investors automate fund data collection, move beyond spreadsheets, and generate audit-ready private markets insights across managers and asset classes.