If you’re a Limited Partner (“LP”) managing multiple private market investments across alternative asset classes - such as Private Equity, Venture Capital, and Private Debt - you know the struggle: a constant stream of reports, statements, and fund notices—each formatted differently, with varying levels of detail.
Every quarter, you are likely to receive:
- Capital call and distribution notices, outlining fund inflows and outflows
- Capital Account Statements (CAS), summarizing your financial position in each fund—committed capital, NAVs, unfunded balances, and distributions
- Quarterly Reports (QRs), detailing underlying holdings, financials, valuations, and key fund events
Unlike liquid markets, where platforms like Bloomberg aggregate and standardize data, private markets operate in silos. Each fund uses its own portal and reporting conventions, leading to:
- Manual retrieval of reports from multiple LP portals
- Data extraction and normalization from diverse fund formats
- Storage across spreadsheets, databases, or portfolio monitoring systems
- Cross-department alignment across operations, accounting, and investment teams
- Custom report preparation for committees, performance reviews, and benchmarking
This process is slow, manual, and error-prone. And as your portfolio grows, it doesn’t scale.
 Why This Problem Is So Costly
At first, a handful of fund commitments may seem manageable. But as allocations to private markets increase, the complexity quickly spirals out of control. Without a proper system, LPs face:
- Missed deadlines – Late capital call payments can damage relationships with GPs
- Fragmented & incomplete data – If data entry is limited to essential fields, deeper portfolio insights are lost
- Reporting headaches – Aggregating data across funds takes days or weeks, delaying critical investment decisions
- High labor & IT costs – Teams spend more time entering data than analyzing it. Spreadsheets inevitably hit their limits, forcing costly software upgrades or custom IT builds.
For sophisticated LPs, these inefficiencies don’t just create frustrations—they introduce real financial and operational risks.
A Scalable Data Management Framework for LPs
The key to solving this challenge is a structured approach. A robust data strategy for LPs should follow three key steps:
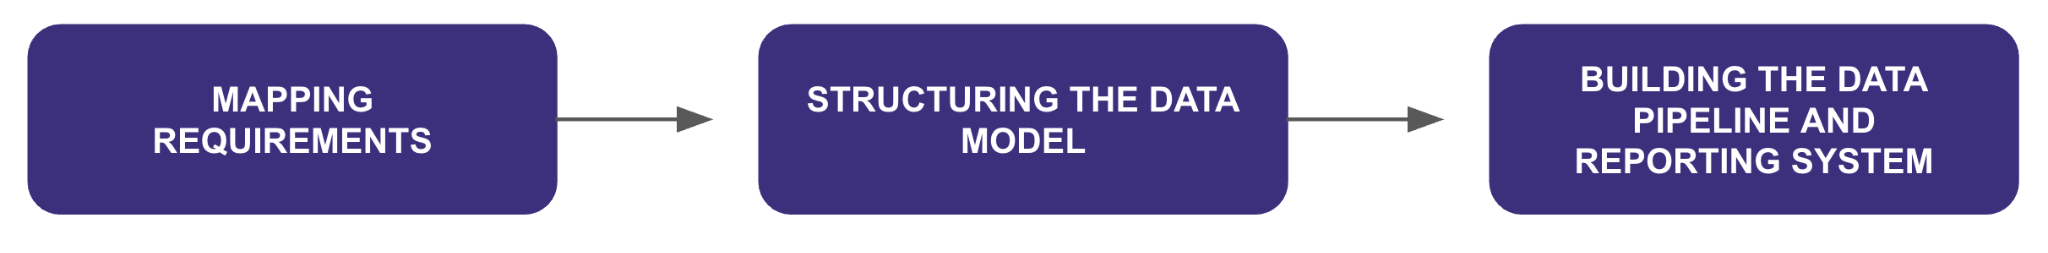
Step 1 - Mapping Requirements
Before building any system, define who relies on investment data and what information they need.
At a high level, every LP needs to:
- Manage cash – Ensuring capital calls and distributions are processed on time
- Monitor exposures – Keeping an up-to-date view of fund positions
- Monitor performance – Comparing returns across funds, vintages, and strategies
- Prepare accounts and reports – Ensuring accurate financial records
- Forecast cash flows and NAVs - Managing liquidity needs and determining pacing
Different teams use this data differently:
- Ops & finance teams focus on call and distributions
- Accounting needs precise figures for financial statements and audits
- Investment teams analyze fund performance, exposures, and risk
- Investment committees & boards rely on high-level dashboards & reports
Mapping these needs into a structured framework ensures your data model captures the right metrics for the right stakeholders.
Step 2 - Structuring the Data Model
A standardized framework ensures consistency across all fund data and supports downstream analytics. To build an effective data model, work backwards from business requirements:
- What are the inputs for each metric? Understanding which raw data points feed into your calculations is essential
- Where does the data come from? Identify whether the data is sourced from fund reports, third-party providers, or internal tracking systems
- What transformations are required? Determine any necessary calculations, aggregations, or mappings needed to make the data usable
A well-structured data model ensures that:
- Raw data is captured in a consistent, structured format regardless of its source
- Third-party data sources can be integrated seamlessly to enhance insights
- Downstream calculations, such as performance metrics (TVPI, IRR, DPI), are computed consistently across all funds
- Missing or incomplete information is managed systematically to prevent inaccuracies in reporting
By defining a strong data model upfront, LPs lay the foundation for automation, reducing manual intervention and improving the quality and reliability of their investment data.
Step 3 - Building the Data Pipeline and Reporting System
Now comes the most critical stage: translating your structured data framework into an operational pipeline that efficiently collects, processes, and delivers insights. This step requires combining technology, processes, and governance to ensure that data remains accurate, timely, and actionable.
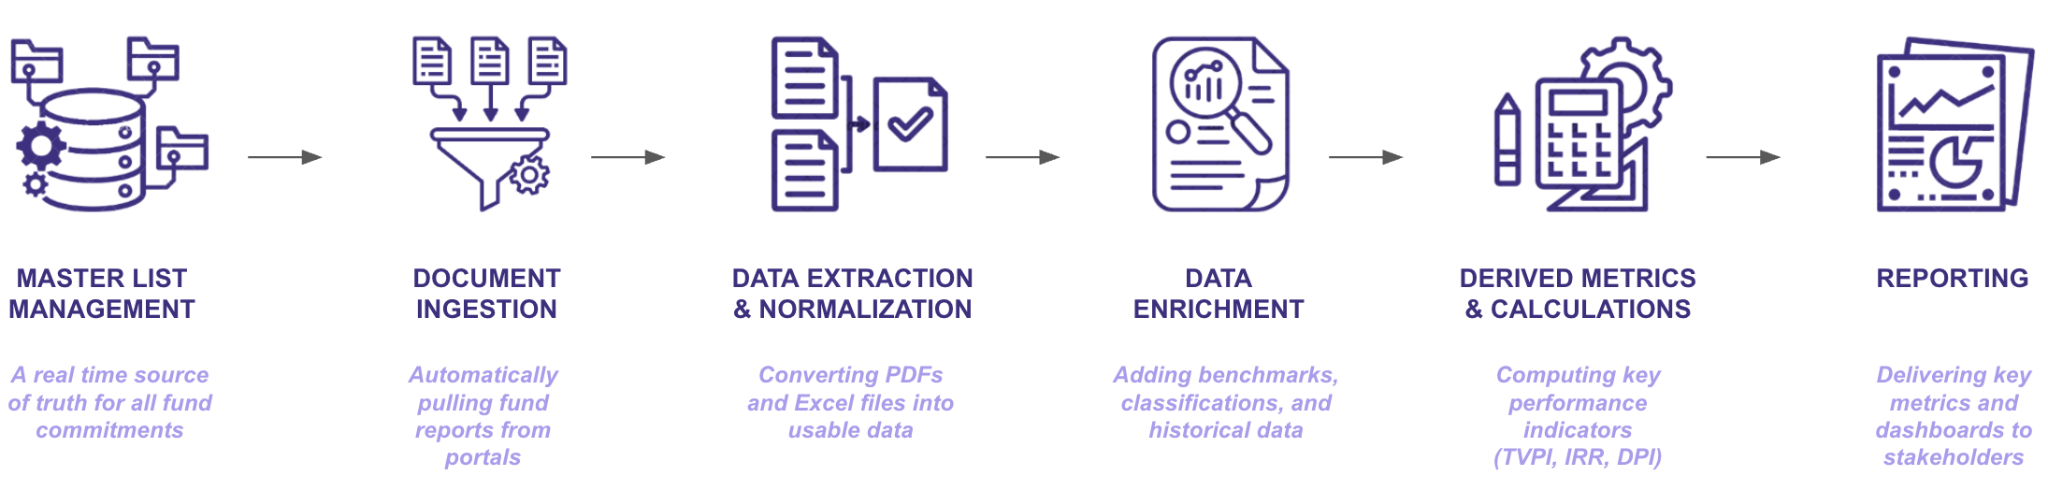
A scalable LP data pipeline should include:
Smaller LPs often rely heavily on human labor and Excel-based tracking. While this may work for a handful of investments, these manual processes quickly become unmanageable as portfolios expand.
Larger institutions typically either build a custom system in-house or invest in a Portfolio Monitoring Solution to streamline their document and data management process.
Example: monitoring TVPIs
Let’s put all these ideas into practice by looking at a specific example. Suppose visibility on TVPI (Total Value to Paid-In Capital) turns out to be a key requirement. Sounds easy, right? Let’s see what it means in practice following the framework above.
Step 1 - Mapping Data Requirements
After internal discussions, you determine that the two main stakeholders are investment and finance teams.
Finance teams need to include TVPIs in their reporting based on actual capital call and distribution activity, while investment teams are more interested in TVPIs from a monitoring perspective. Specifically, they would like to compare TVPIs against third-party benchmarks (to evaluate fund performance against industry trends) and against the fund-level TVPI across all LPs (to assess if they got a better or worse terms).
Summarizing:
|
Metric |
Goal |
Stakeholder |
|
TVPI (LP level) |
Reporting actual performance |
Finance team |
|
TVPI (benchmarks) |
Benchmarking performance vs peers |
Investment team |
|
TVPI (fund level) |
Monitoring |
Investment team |
Step 2 - Structuring the Data Model
Now that we have a clearer understanding of what TVPI means, we can structure the data model:
|
Metric |
Construction |
Raw inputs and source |
|
TVPI (LP level) |
(total distributed + last NAV) / total called |
Calls and distributions <- notices NAVs <- Capital Accounts Statements |
|
TVPI (benchmarks) |
TVPI quartiles <- Third party data providers |
|
|
TVPI (fund level) |
Reported headline TVPI <- Quarterly Reports |
Step 3 - Building the Data Pipeline and Reporting System
How do we ensure this data is collected and utilized effectively? Let’s assume the team decides to manage the process manually in Excel as a starting point.
A potential pipeline strategy could be structured as follows:
- The Investment and Finance teams share responsibility for maintaining an official master list of investments.
- Document ingestion and data processing—covering extraction, normalization, and enrichment—are divided between the two teams based on data type:
- The Finance team handles Capital Account Statements and Notices.
- The Investment team processes Quarterly Reports and external benchmarking data. - Both teams use a shared Excel file to store all data, support Derived Metrics, and serve as the single source of truth for reporting.
Make or Buy? Choosing the Right Data Solution for LPs
For many LPs, data management starts with a simple spreadsheet—often an Excel file shared across teams. But as portfolios grow, so does the complexity of tracking GP documents, ensuring data accuracy, and enabling teams to have access to timely and complete information. At some point, every LP faces a critical decision: should they build a custom data management and portfolio monitoring solution, or invest in an existing platform?
The Case for Building In-House
For LPs with unique needs or stringent security requirements, developing an in-house solution may seem like the logical choice - but there are challenges, too:
|
Advantages |
Disadvantages |
|
✅ Tailored Customization – A bespoke system can be built to address highly specific workflows and data structures that off-the-shelf solutions might not support. |
🚨 High Costs & Resource Demands – Developing and maintaining a proprietary system requires a substantial investment in both time and financial resources. |
|
✅ Full Control Over Security & Architecture – With an internally managed system, firms can dictate how data is stored, accessed, and protected, ensuring compliance with internal and regulatory standards. |
🚨 Long Development Timelines – From initial design to full deployment, custom solutions can take months or even years to perfect. |
|
✅ Leverage Internal Expertise – If an LP has a well-equipped tech team with deep experience in financial data systems, they may be able to develop a highly effective proprietary solution. |
🚨 Ongoing Maintenance & Scalability – Even after launch, in-house tools require continuous updates, support, and scalability improvements. |
The Case for Buying a PMS or Data Automation Tool
On the other hand, investing in a Portfolio Management System (PMS) or a data automation platform can provide a faster, more efficient way to handle portfolio data - of course caveats also apply:
|
Advantages |
Disadvantages |
|
✅ Faster Deployment – Pre-built data pipelines allow for quicker implementation. |
🚨 Customization Limitations – While many PMS providers offer flexible configurations, they may not fully accommodate the unique needs of every LP. |
|
✅ Reduced Manual Work & Errors – Automated data aggregation and reconciliation significantly reduce the risk of human error. |
🚨 Vendor Lock-In Risks – Switching providers or migrating data in the future can be complex and costly. |
|
✅ Advanced Analytics & Reporting – Many platforms offer built-in dashboards, performance tracking tools, and customizable reporting features. |
Scalability as the Deciding Factor
For most LPs, the "make vs. buy" decision ultimately comes down to scalability. While spreadsheets may suffice for those managing a handful of funds with a relatively straightforward monitoring approach, once portfolios expand beyond 10+ funds, manual data tracking quickly becomes unsustainable. At that point, an automated system is no longer a luxury but a necessity.
Conclusion: Building a Scalable LP Data Strategy
Regardless of whether an LP chooses to build or buy, the goal remains the same: creating a scalable, efficient, and reliable data management strategy. A well-structured system enables LPs to:
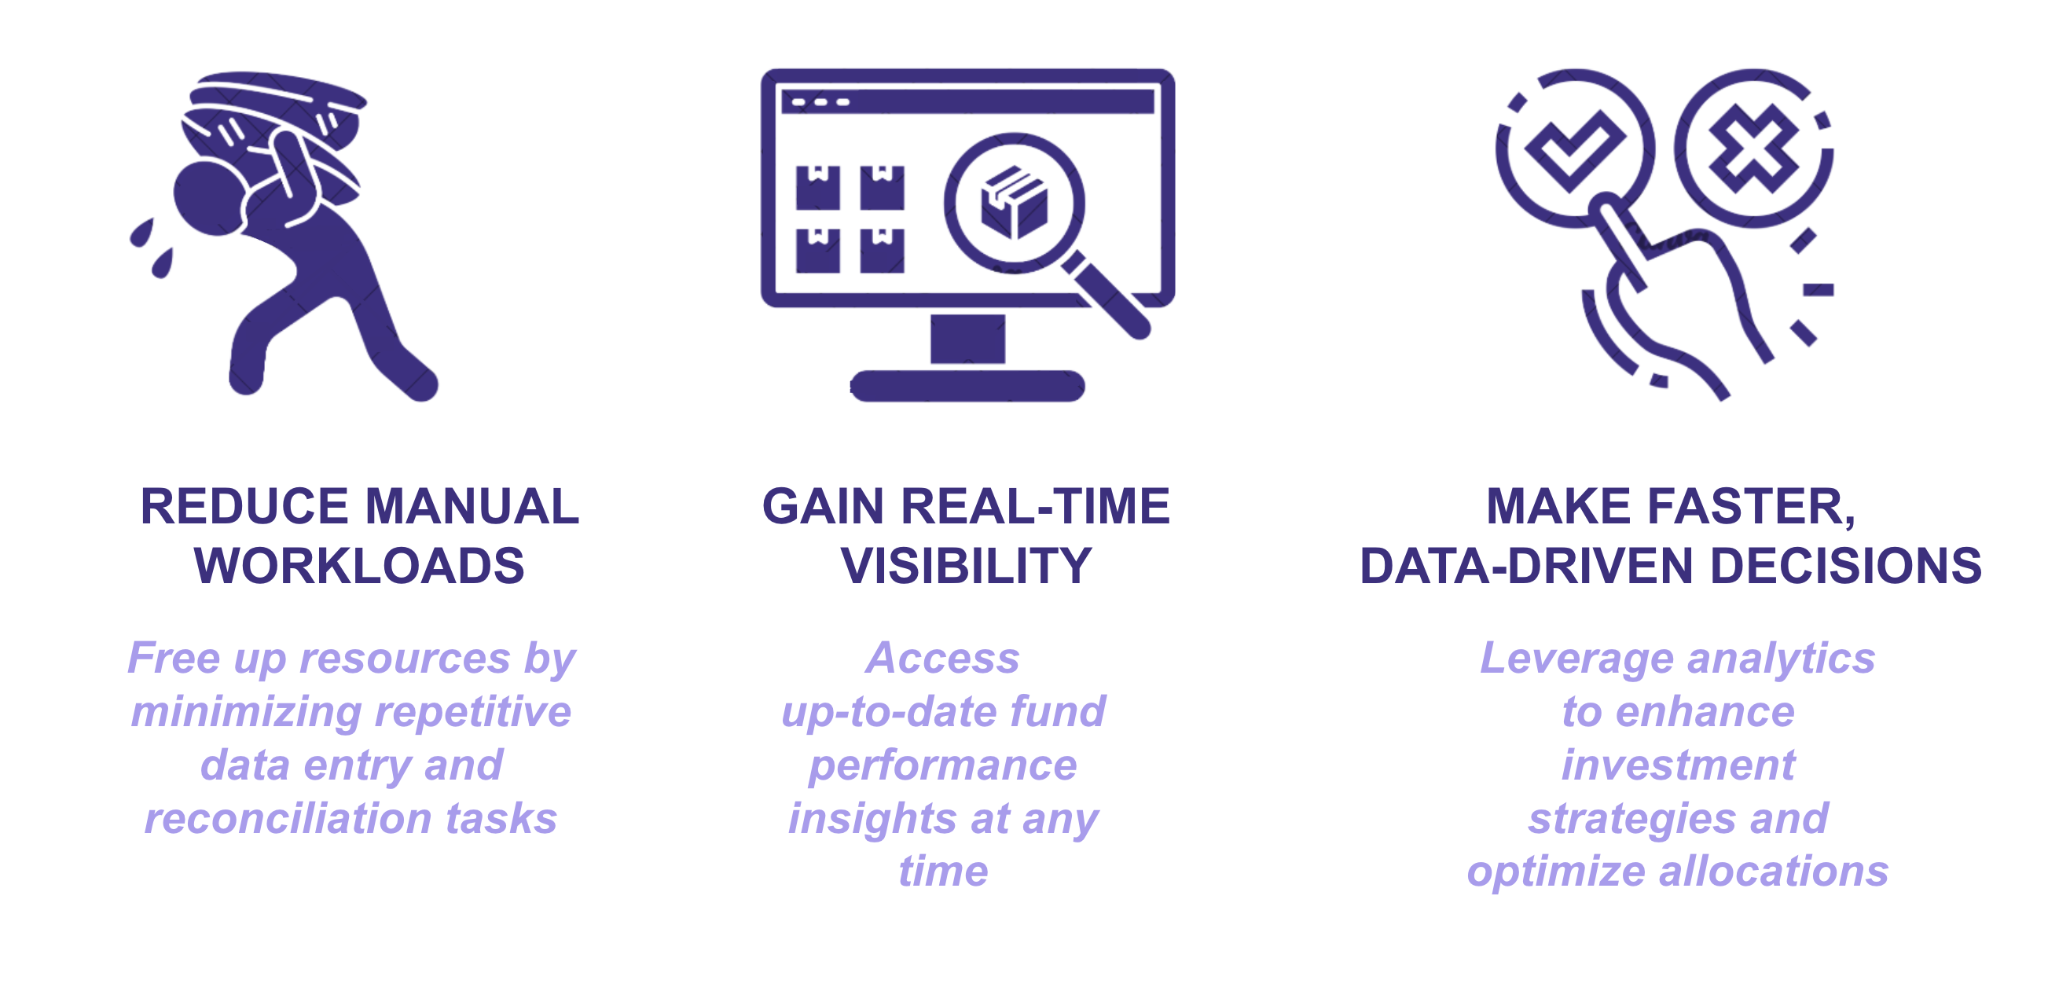
As private markets continue to grow and data complexity increases, LPs that proactively invest in robust data solutions will be well-positioned to gain a competitive advantage.